Dame Products
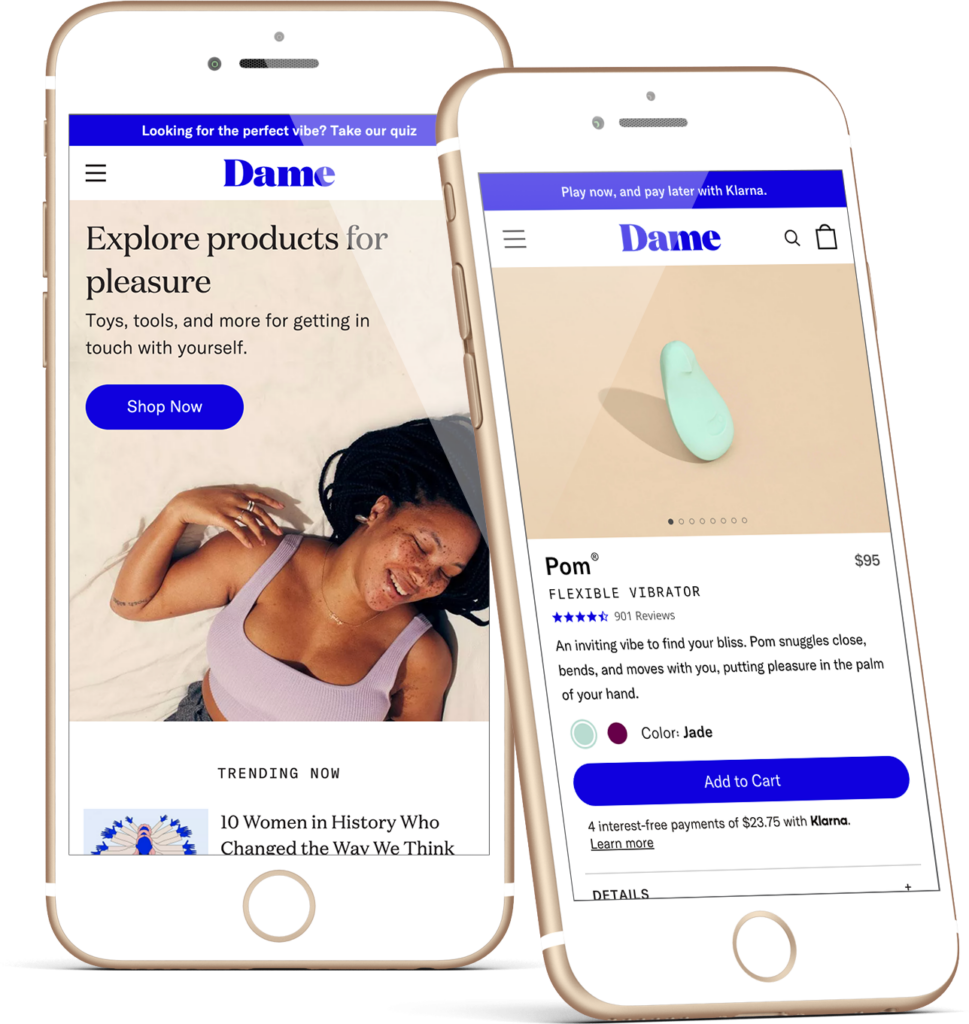
The sexual wellness brand faced conversion challenges due to strict advertising restrictions. I improved the user experience and refined the brand’s visuals, increasing conversion rates and revenue. Analyzing user behavior, conducting market research, and implementing best practices were vital to enhancing the brand’s ability to convert its audience.
Role
UX/UI Designer & Front-End Developer
Tools + Skills
Conversion Rate Optimization, Shopify Plus, Sketch, Figma, Adobe Creative Suite, HTML/CSS, Javascript, Shopify Liquid
Duration
Background
Dame aimed to improve their website's conversion rates and approved a sitewide facelift in October 2019. As the designer and developer, I led the effort to identify areas of improvement utilizing a site audit and implemented the updates before the holiday season.
Audit Takeaways
- Lack of clear visual hierarchy
- Color usage was aesthetic, not intentional
- Inconsistent typography between headers
- Information presented was overwhelming
- Poor use of screen real estate
- Customer confusion around value props
Solutions
- An iterative redesign with a quick phase one
- Refinement of brand identity and visual language
- Product quiz creation to assist decision making
Phase One Designs
To maximize holiday revenue, we approached the redesign in phases. In the initial phase, we prioritized critical touchpoints in the user journey - the PDP, PLP, and the homepage. This phase was designed and built within six weeks.
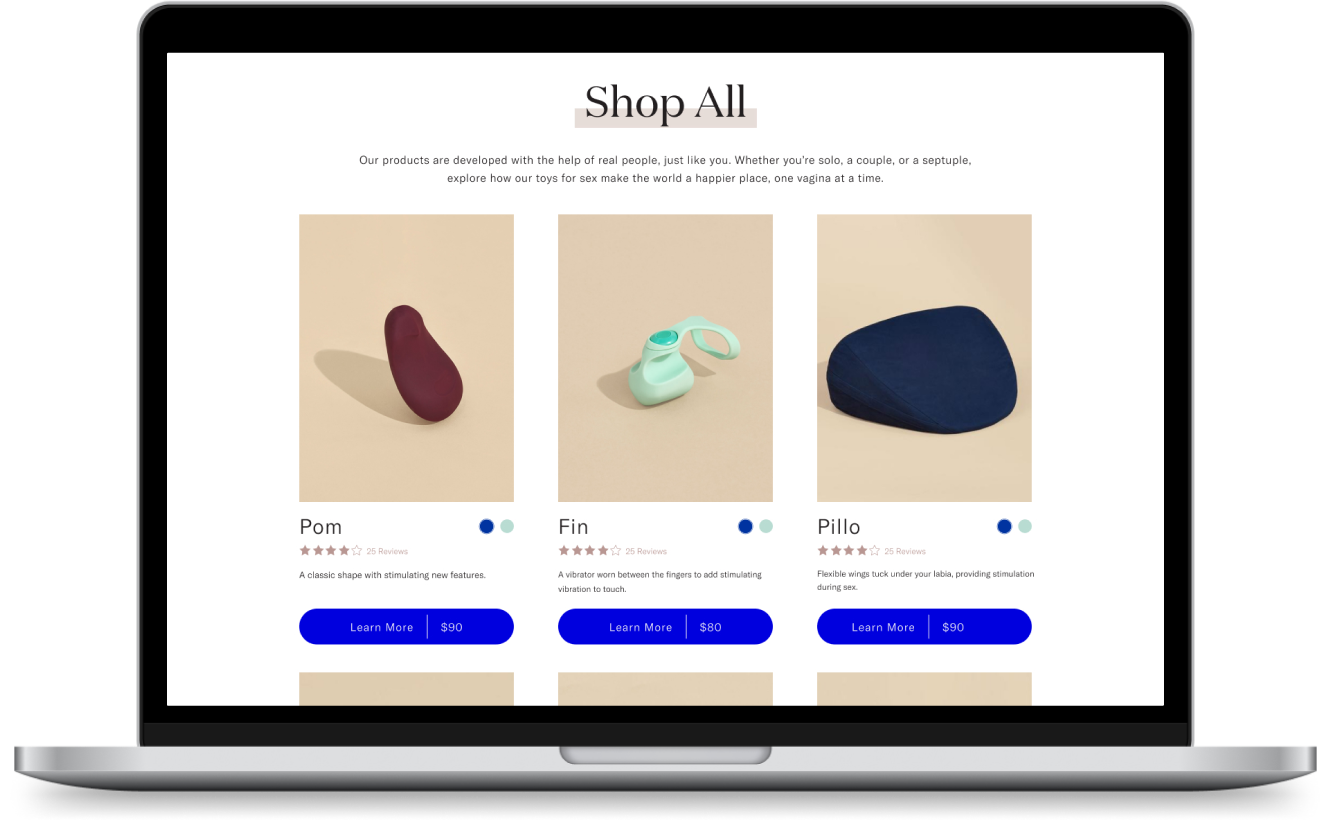
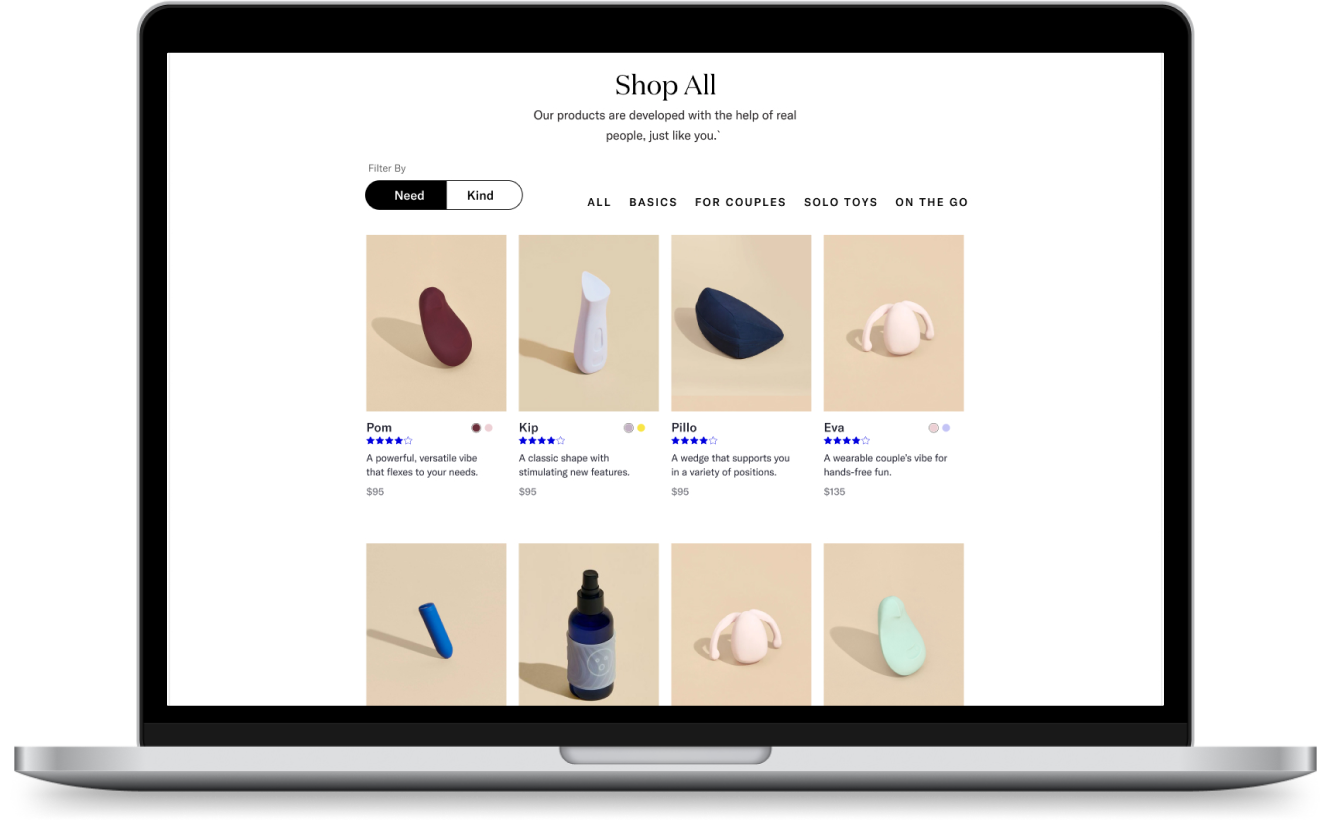
Product Listing Page
The following changes were made to the PLP in phase one:
- Added filtering by product type or customer needs.
- Reduced visual clutter by removing the bright buttons
- Increased the items per row for easier browsing
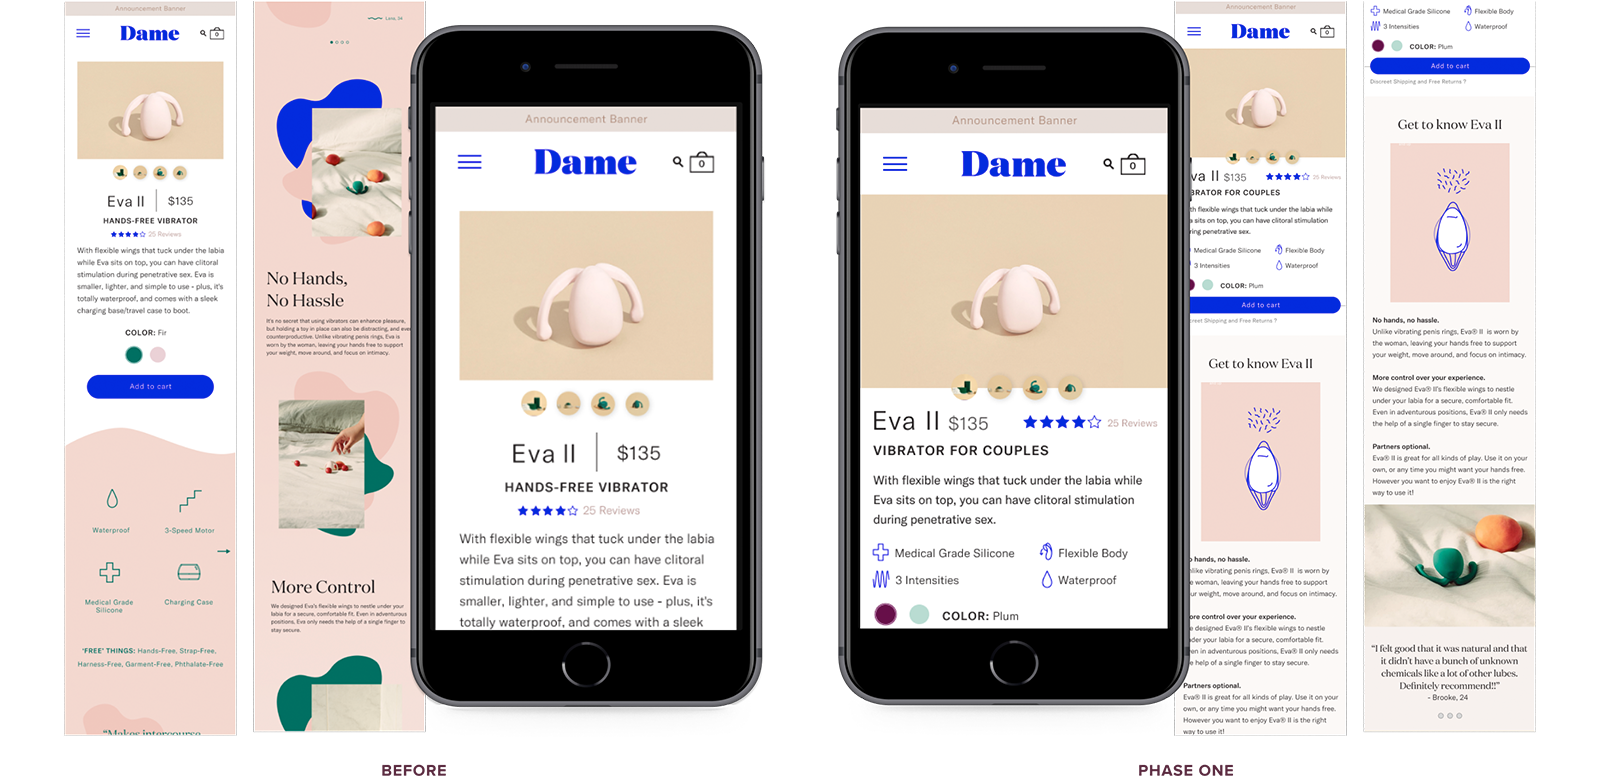
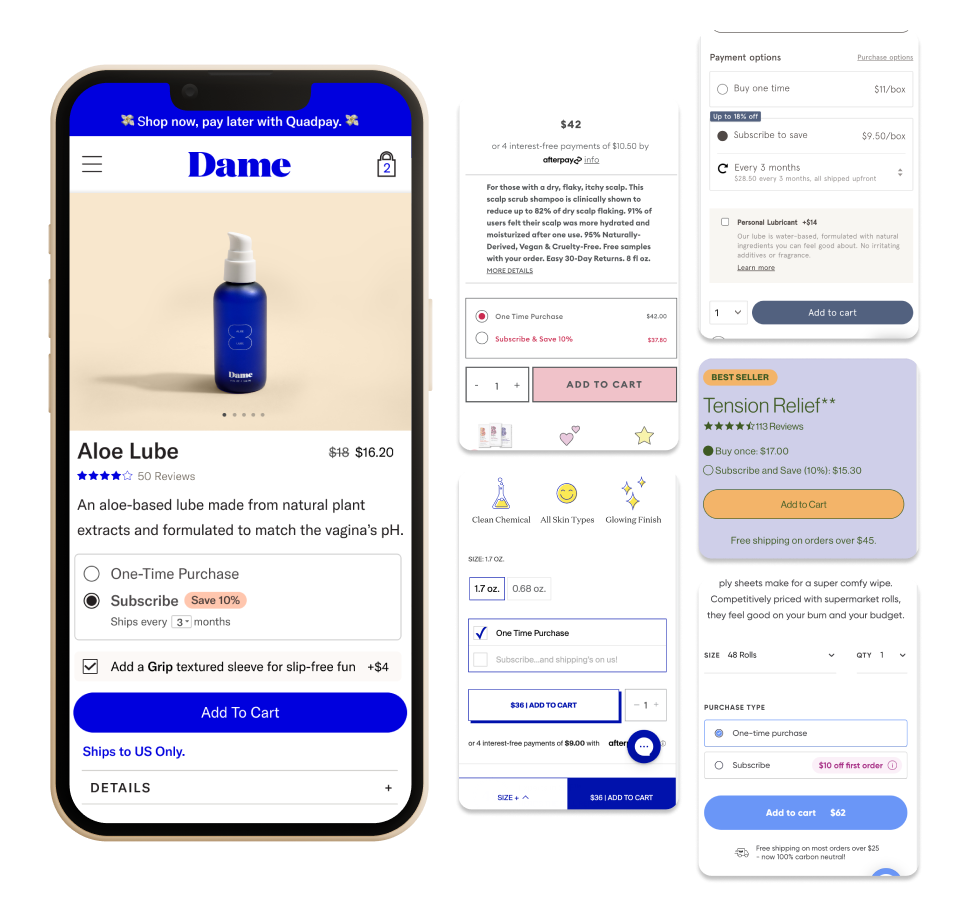
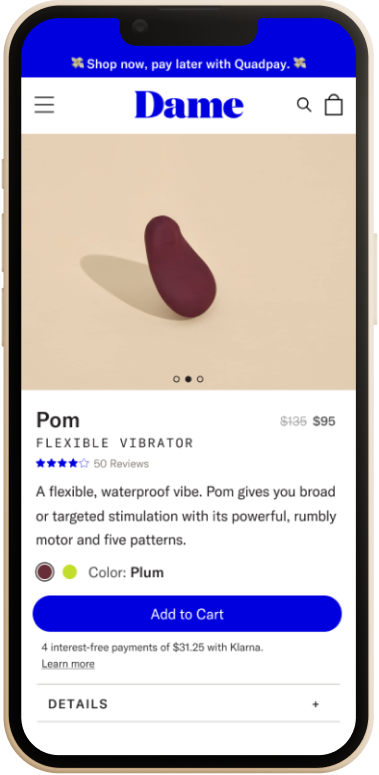
Product Detail Page
The following changes were made to the PDP in phase one :
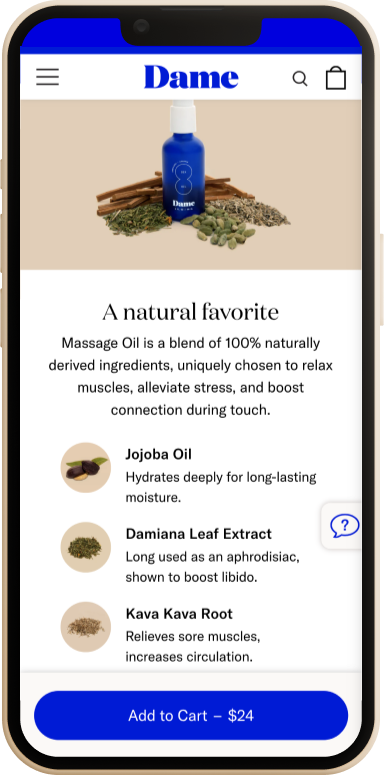
- Created color use guidelines for a consistent scheme across all products, removing irrelevant graphics.
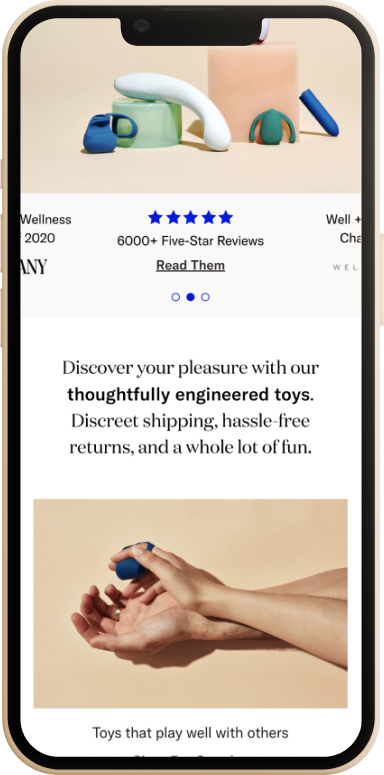
- Reorganized the layout to prioritize the most valuable content, reducing the need for excessive scrolling to access crucial information.
- Identified a higher interaction with the lifestyle images based on heatmaps and subsequently relocated them to the image carousel for enhanced user engagement.
Refining Further
An Evolving System
After completing high-priority optimizations, we focused on bringing the rest of the site in line with a design system.
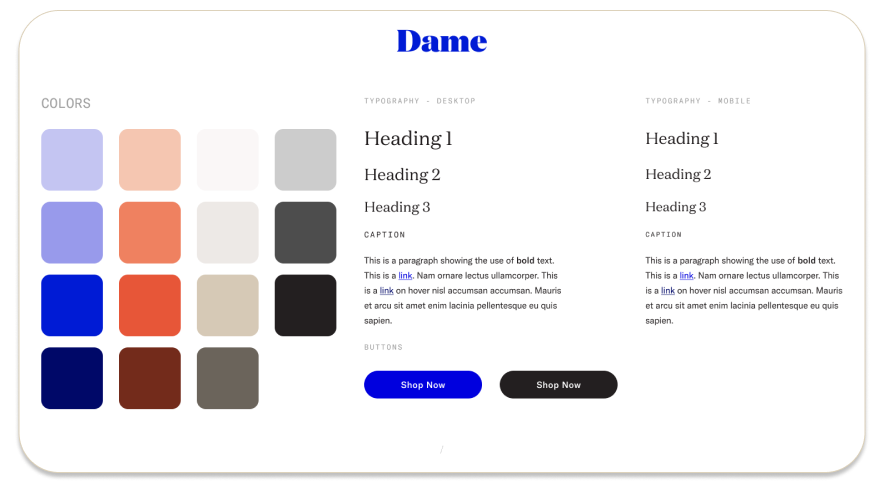
I developed a scalable style guide for typography and colors to accommodate the period before finalizing Dame's new brand identity.


Prototypes in Action
Since updating the PLP in phase one, I have continued to make improvements such as enhancing the filters, implementing sort functionality, and enhancing overall usability of the page.
View the prototype in Figma.
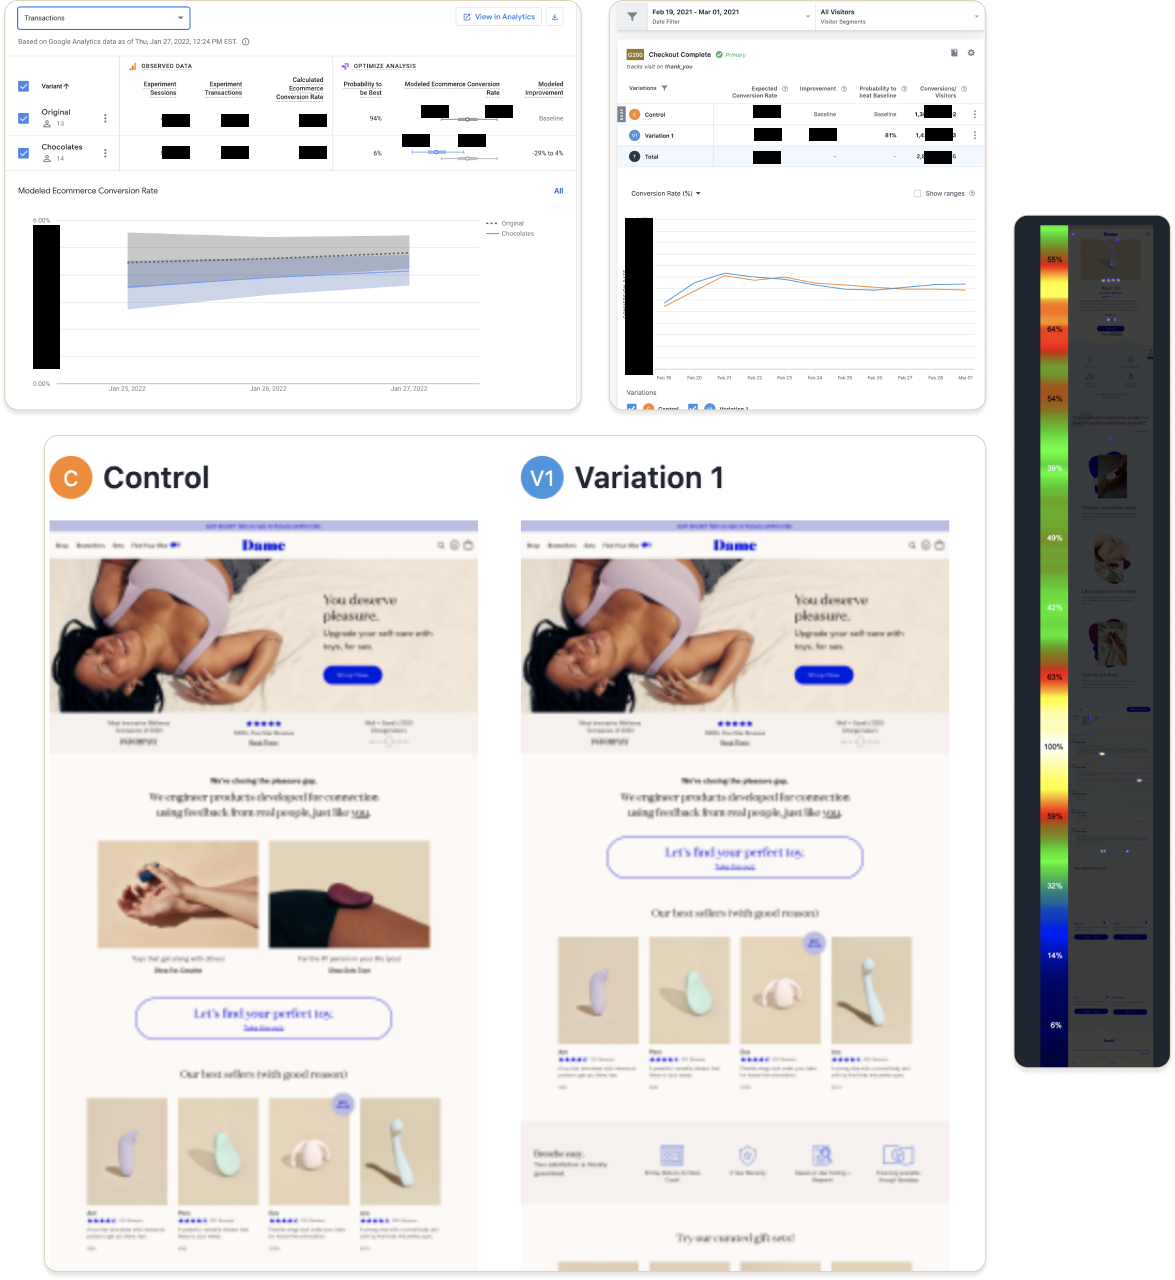
Data-Driven Design
After deploying designs, I leverage analytics, heatmaps, and A/B testing data to further improve the site.
By interpreting the story behind the data, we can shape future versions of the site to better meet the needs of our users.
Using Comparative Data
A competitive audit of 39 competitors informed the cart drawer redesign, resulting in several design decisions to improve its functionality, including updates to the progress bar and upsell section.
To communicate these changes and the audit findings to stakeholders, I created a deck explaining data-driven decisions, which proved instrumental in gaining their buy-in.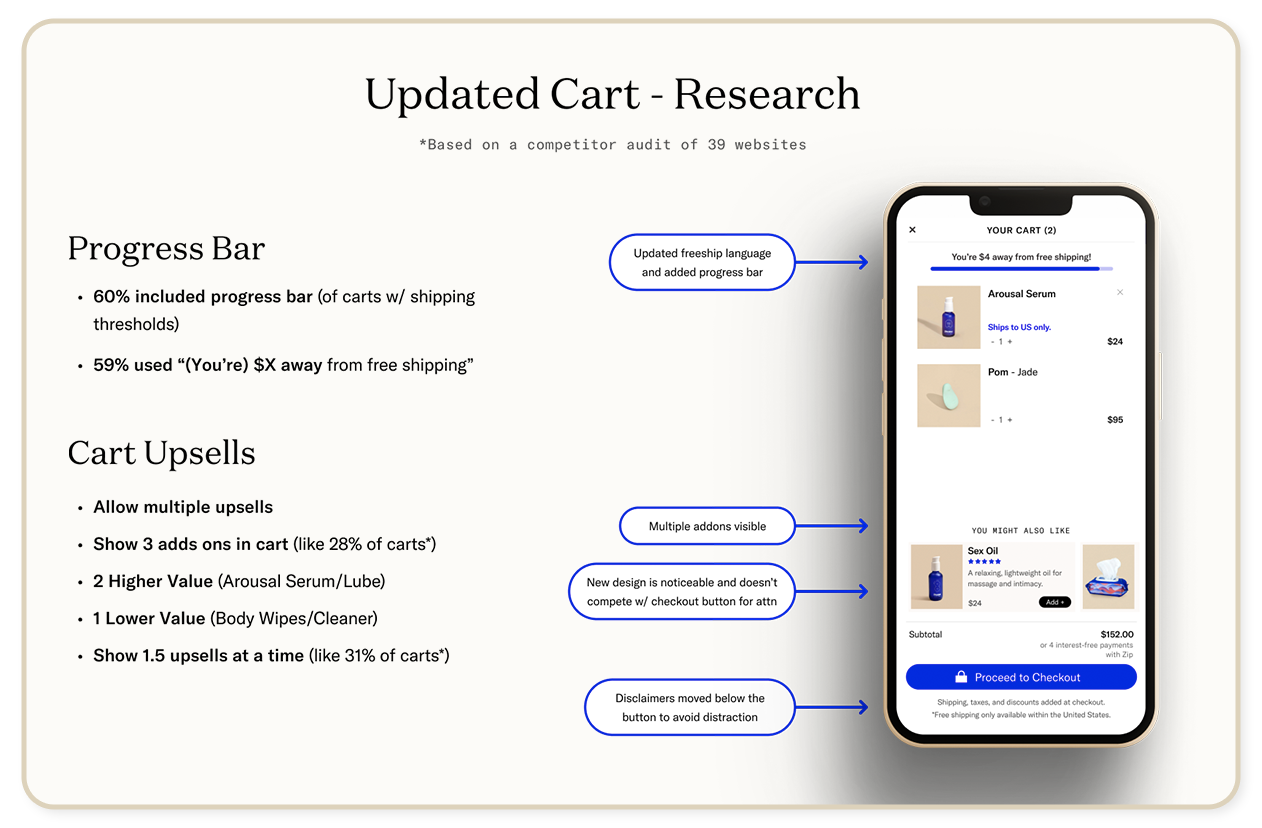
Leveraging Data Analysis for Better Ad Performance
One podcast accounted for 10% of partner traffic and a whopping 75% of podcast traffic. After listening to the placement, I tailored the landing page copy to fit their audience. The result was so successful that they mentioned it in their next episode, further increasing brand affinity among their listeners.
Despite having to discontinue the advertisement due to guideline reasons, over a year later, the placement was still driving significant revenue.
Finding Best Practices
A competitor analysis and industry trends influenced the redesign of Aloe Lube's subscription module. By evaluating other companies offering subscription services, I identified the most functional aspects and drew inspiration from them to recreate the design.
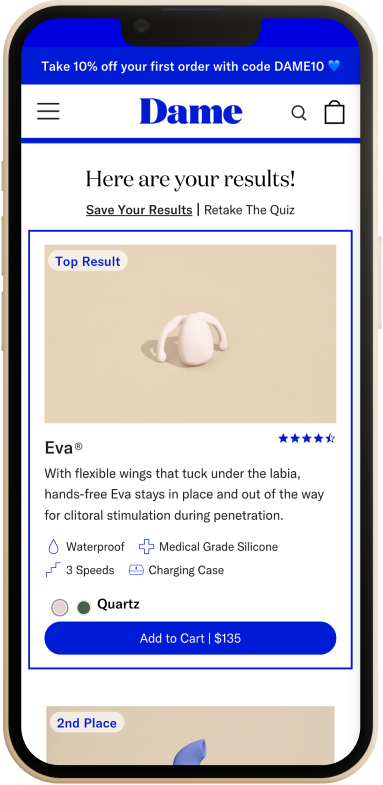
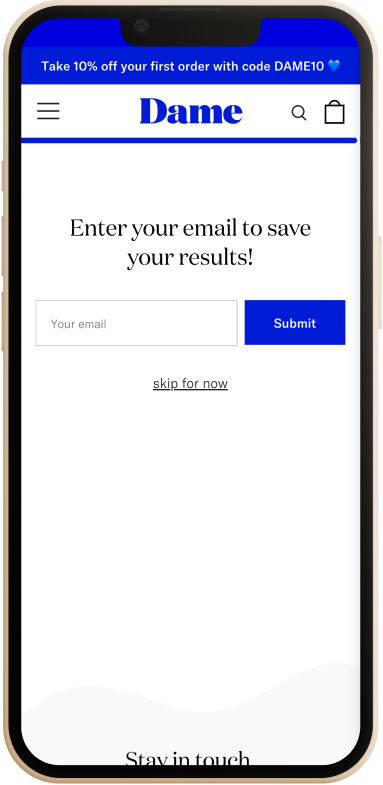
Product Quiz
To better assist users with their decision-making process, we developed a product quiz in collaboration with Customer Service and Product teams.
By taking into consideration the actual needs and preferences of our users, we aimed to create a valuable tool that could provide personalized recommendations and improve the overall user experience.
Primary Goal
Secondary Goal
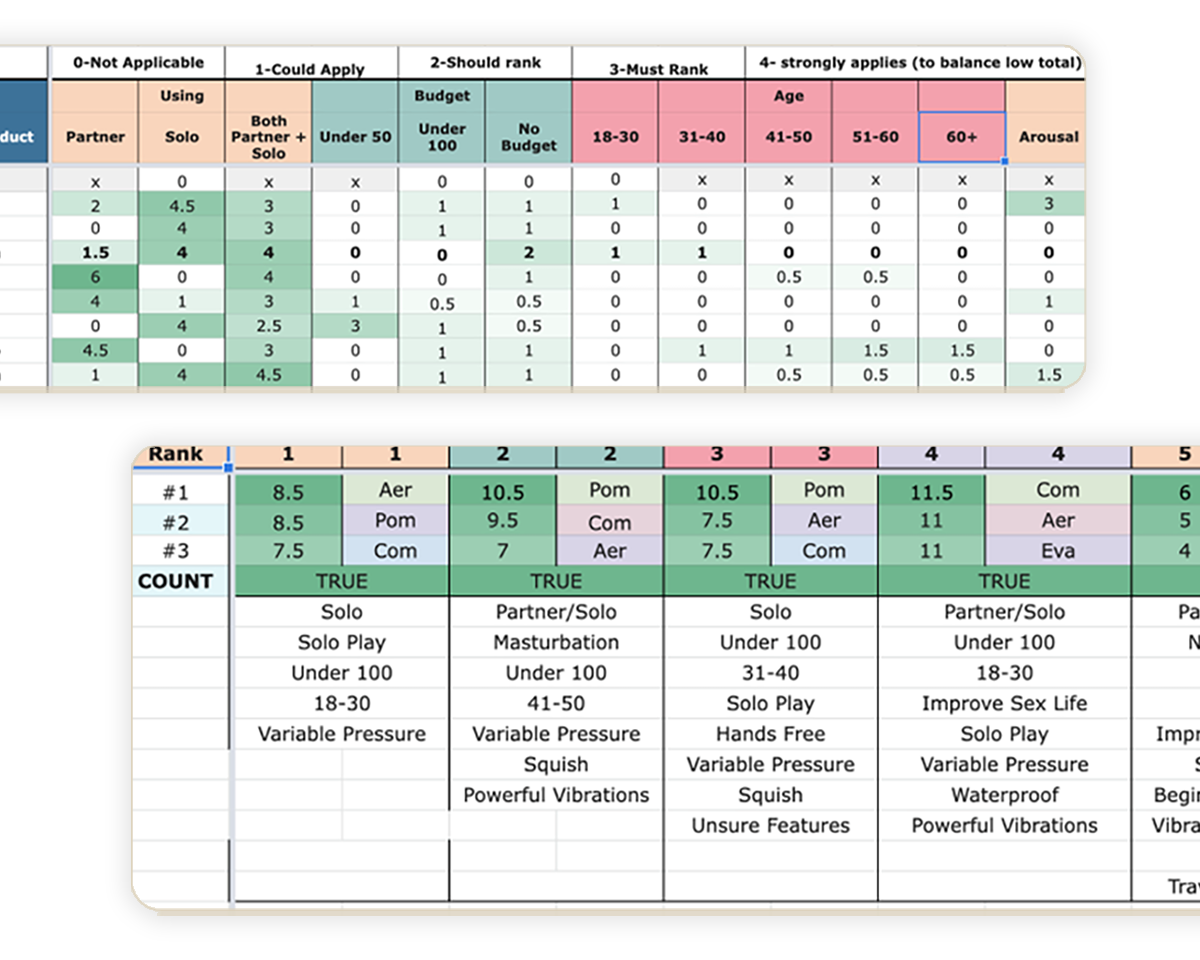
Accurate Results
We created a rubric to rank products and conducted sample surveys to test its effectiveness. Through data analysis and fine-tuning, we ensured the rubric provided accurate recommendations in various scenarios and weighted necessary options to increase accuracy.
By continuously refining the rubric through testing and feedback, we developed a robust system for personalized product recommendations.
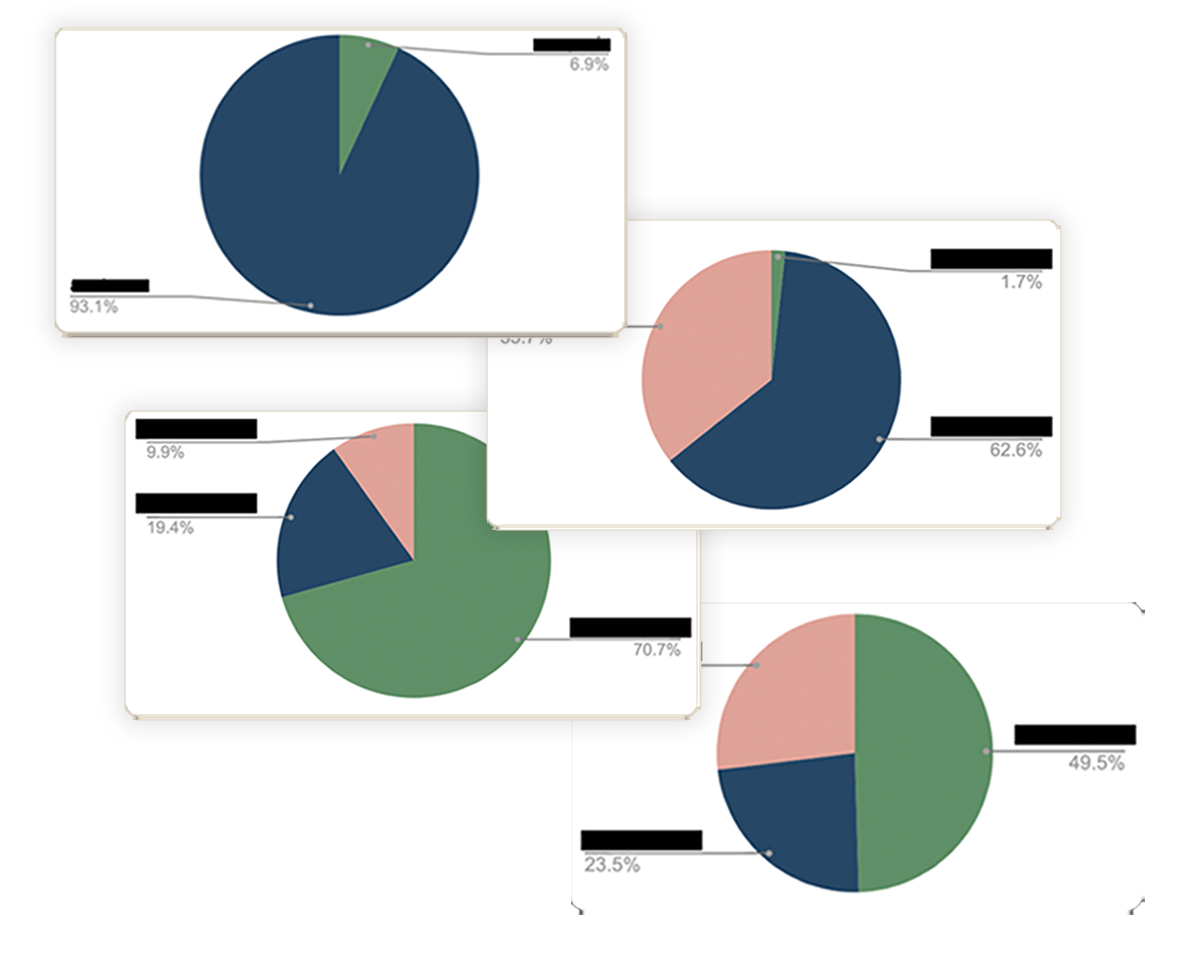
Improving Further
After a year, we had the bandwidth to improve the quiz. Answer data shaped version two. We found that it had a low dropoff rate, with 95% of users completing the quiz.
We had asked, "Who are you shopping for?" Less than 2% of users were buying a gift for someone else, so we reframed the question. Instead, we asked, "How do you plan to use it?" which yielded more helpful results and simplified the flow.
Takeaways
- Dame saw a 73% improvement to its yearly conversion rate after the initial changes were implemented.
- “Done, not perfect” allows for consistent improvements without missing opportunities for revenue
It wouldn’t be out of place to describe Lauren as a “unicorn”. Not only does she have the technical and design skills to implement, she has the analytical ability to improve conversion and process. Lauren also works cross-functionally with ease by being a fast, reliable and communicative team player. This combination of soft and hard skills made Lauren an incredibly valuable addition to the Dame team.